Monitor Amazon Bedrock batch inference using Amazon CloudWatch metrics
Sources: https://aws.amazon.com/blogs/machine-learning/monitor-amazon-bedrock-batch-inference-using-amazon-cloudwatch-metrics, https://aws.amazon.com/blogs/machine-learning/monitor-amazon-bedrock-batch-inference-using-amazon-cloudwatch-metrics/, AWS ML Blog
TL;DR
- Amazon Bedrock batch inference enables bulk processing of large datasets at about 50% lower cost than on-demand inference, making it suitable for historical data analysis, large-scale text summarization, and background processing.
- Bedrock now automatically publishes batch inference metrics under the AWS/Bedrock/Batch namespace in CloudWatch.
- Metrics can be viewed per modelId and include records pending processing, input tokens processed per minute, and output tokens processed per minute; Anthropic Claude models also expose tokens pending processing.
- You can start a batch inference job from the Console, AWS SDKs, or AWS CLI, and then monitor the workload with CloudWatch Metrics Insights, alarms, and dashboards.
- Proactive monitoring and automation—such as alarms that trigger SNS notifications—can help optimize performance and cost across Bedrock batch workloads. For more details, see the original AWS blog post on monitoring Bedrock batch inference with CloudWatch metrics AWS Blog.
Context and background
As organizations scale their generative AI initiatives, many workloads prioritize cost-efficient bulk processing over real-time responses. Amazon Bedrock batch inference addresses this need by enabling large datasets to be processed in bulk with predictable performance and at a reduced cost compared with on-demand inference. This makes it well suited for tasks such as historical data analysis, large-scale text summarization, and other background processing workloads. The AWS blog highlights that Bedrock batch inference now publishes metrics automatically to CloudWatch under the AWS/Bedrock/Batch namespace, enabling visibility into batch workload progress and resource usage. You can start a batch inference job using the AWS Management Console, AWS SDKs, or the AWS CLI, and you can monitor progress and performance through CloudWatch metrics. When using CloudWatch, there is a dedicated set of metrics you can monitor for batch workloads. Current Amazon Bedrock models expose metrics such as records pending processing, input tokens processed per minute, and output tokens processed per minute. For Anthropic Claude models, tokens pending processing are also reported. Metrics are available per modelId, allowing you to track performance and cost at the model level. This new visibility supports deeper insight into batch workloads and enables more precise optimization and governance of Bedrock batch inference. If you want to explore how to view and analyze these metrics, CloudWatch provides Metrics Insights for querying and visualizing data across the AWS/Bedrock/Batch namespace. The post also discusses best practices for monitoring, including proactive alerting and automation to respond to workload changes and cost considerations. The overall goal is to maximize efficiency and value from Bedrock batch inference by combining metrics, alarms, and dashboards.
What’s new
- Automatic publishing of batch inference metrics under the AWS/Bedrock/Batch namespace in CloudWatch.
- ModelId scoped metrics, including: records pending processing; input tokens processed per minute; output tokens processed per minute; and tokens pending processing for Anthropic Claude models.
- Expanded model support and deeper visibility into batch progress, enabling more granular monitoring and troubleshooting.
- Enhanced cost monitoring capabilities to better track and optimize Bedrock batch workloads.
- Simplified workflows to start batch inference jobs via Console, SDKs, or CLI, and to set up alarms and dashboards for ongoing operations. By enabling these new telemetry and control features, Bedrock batch inference becomes more transparent and easier to operate at scale. The blog notes that these improvements support better performance, cost management, and operational insight for teams running large-scale generative AI workloads. You can get started by launching a Bedrock batch inference job, configuring CloudWatch alarms, and building a monitoring dashboard to observe progress and cost patterns.
Why it matters (impact for developers/enterprises)
For developers and enterprises alike, the updated Bedrock batch inference monitoring workflow delivers several practical benefits:
- Proactive visibility: CloudWatch metricsProvide real-time and historical visibility into batch workloads, making it easier to detect slowdowns, bottlenecks, or cost spikes before they impact stakeholders.
- Automated responses: Alarms and SNS notifications enable automated or semi-automated responses, such as notifying an operations team or triggering downstream data pipelines.
- Cost transparency: With metrics that reflect tokens processed and tokens pending, teams can better understand cost drivers and optimize batch processing to meet budget targets.
- Centralized monitoring: Dashboards consolidate batch workload data, enabling faster troubleshooting and more informed capacity planning.
- Scalable governance: Model-level metrics help governance by isolating performance and cost signals to specific models, a key capability when operating multiple Bedrock models in production. These capabilities align with common enterprise objectives: ensuring predictable performance for bulk AI tasks, controlling spend, and maintaining operational readiness for large-scale generative workloads. All of these benefits stem from the combination of CloudWatch metrics, alarms, and dashboards that are now augmented with Bedrock batch inference telemetry.
Technical details or Implementation
Start and configure batch inference
- You can start a batch inference job in Bedrock using the AWS Management Console, AWS SDKs, or AWS CLI. The blog emphasizes that the process is supported across these interfaces, but the specifics of each method are documented elsewhere in Bedrock’s user guides.
- Once a batch job is running, Bedrock begins publishing metrics for that job under the AWS/Bedrock/Batch namespace in CloudWatch, giving you visibility into workload progress and resource usage.
CloudWatch metrics and where to view them
- The core metrics you’ll monitor include:
- Records pending processing
- Input tokens processed per minute
- Output tokens processed per minute
- For Anthropic Claude models, an additional metric is tokens pending processing. These metrics can be viewed per modelId, enabling model-specific monitoring and comparison across models.
- To view and analyze these metrics, you can use the CloudWatch console and Tools such as Metrics Insights for querying and visualizing data from the AWS/Bedrock/Batch namespace.
Practical examples: alerts and automation
- A concrete example from the blog describes creating a CloudWatch alarm that triggers when the average NumberOfInputTokensProcessedPerMinute exceeds 1,000,000 within a 6-hour period. Such an alarm can invoke an SNS notification to alert the operations team or initiate downstream data pipelines.
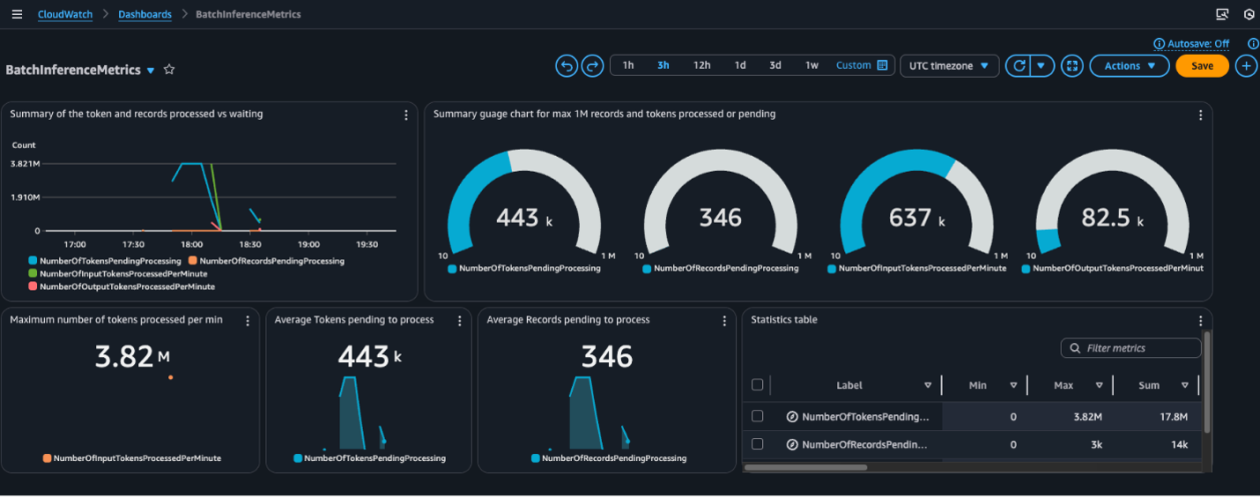
- You can also build a CloudWatch dashboard to centralize the relevant metrics for monitoring and troubleshooting Bedrock batch workloads. Dashboards provide a single pane of glass for observing progress, detecting anomalies, and correlating metrics with costs.
Implementation notes and best practices
- Use modelId-scoped metrics to diagnose performance or cost issues at the model level, which is especially valuable when managing multiple Bedrock models.
- Leverage CloudWatch Metrics Insights to perform ad hoc analyses and to create more targeted dashboards and queries.
- Combine metrics with alarms and dashboards as part of a proactive monitoring and automation strategy to maximize efficiency and value from Bedrock batch workloads.
Key takeaways
- Bedrock batch inference supports bulk data processing with predictable performance at a lower cost than on-demand inference.
- CloudWatch now publishes batch metrics under AWS/Bedrock/Batch, including per-modelId insights and tokens-based throughput metrics.
- Proactive monitoring, alarms, and dashboards enable better performance management, cost control, and operational transparency for batch workloads.
- You can start batch inference via Console, SDKs, or CLI and then wire up alarms and dashboards to automate responses and observability.
Key takeaways
- New telemetry in CloudWatch: AWS/Bedrock/Batch metrics with per-modelId granularity.
- Metrics include records pending, input/output tokens per minute; Claude models expose tokens pending as well.
- Alarms and dashboards support proactive management and cost optimization for batch workloads.
- End-to-end workflow: launch batch inference, set up CloudWatch alarms, build dashboards, and monitor continuously.
FAQ
-
What problem does Bedrock batch inference solve?
It enables large datasets to be processed in bulk with predictable performance at about 50% lower cost than on-demand inference, suitable for bulk analytics and background processing tasks.
-
What metrics are available for monitoring batch inference?
Metrics published under the AWS/Bedrock/Batch namespace include records pending processing, input tokens processed per minute, and output tokens processed per minute. For Anthropic Claude models, tokens pending processing are also reported. Metrics can be viewed per modelId.
-
How can I set up alerts and automated responses?
You can create CloudWatch alarms (for example, when the average tokens processed per minute exceeds a threshold) that trigger actions such as SNS notifications to the Ops team or downstream pipelines.
-
How do I start a batch inference job?
You can start a batch inference job in Bedrock using the AWS Management Console, AWS SDKs, or AWS CLI, and then monitor its progress via CloudWatch metrics.
-
Where can I view the batch metrics?
In the CloudWatch console under the AWS/Bedrock/Batch namespace, with per-modelId granularity available for the metrics.
References
- AWS Blog: Monitor Amazon Bedrock batch inference using Amazon CloudWatch metrics. https://aws.amazon.com/blogs/machine-learning/monitor-amazon-bedrock-batch-inference-using-amazon-cloudwatch-metrics/
More news
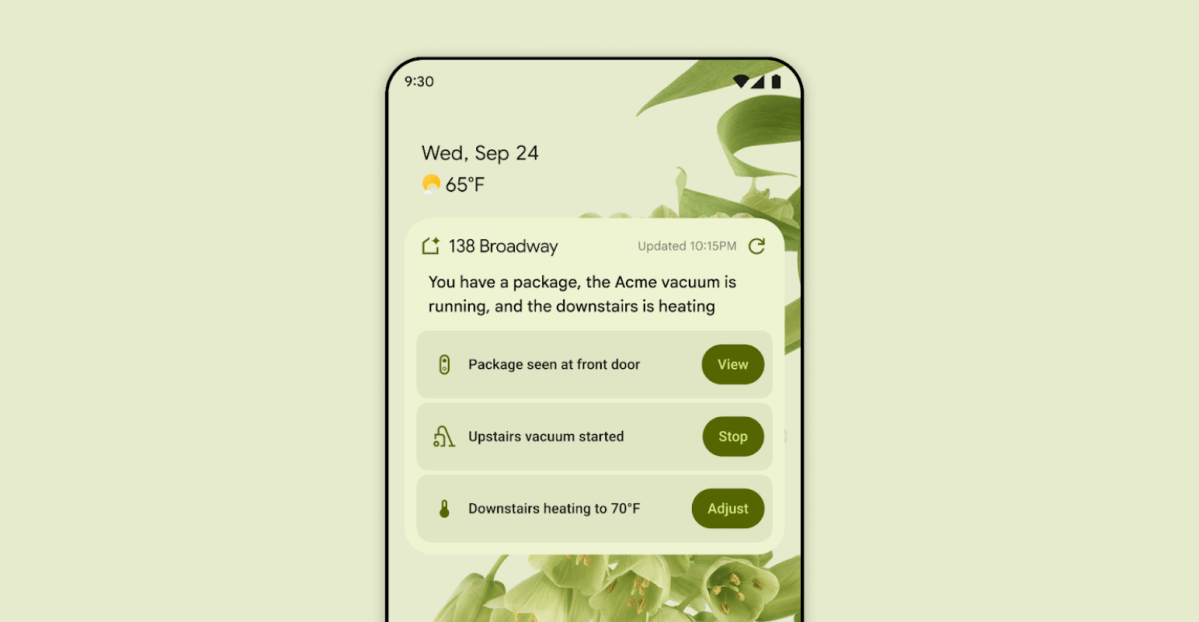
First look at the Google Home app powered by Gemini
The Verge reports Google is updating the Google Home app to bring Gemini features, including an Ask Home search bar, a redesigned UI, and Gemini-driven controls for the home.
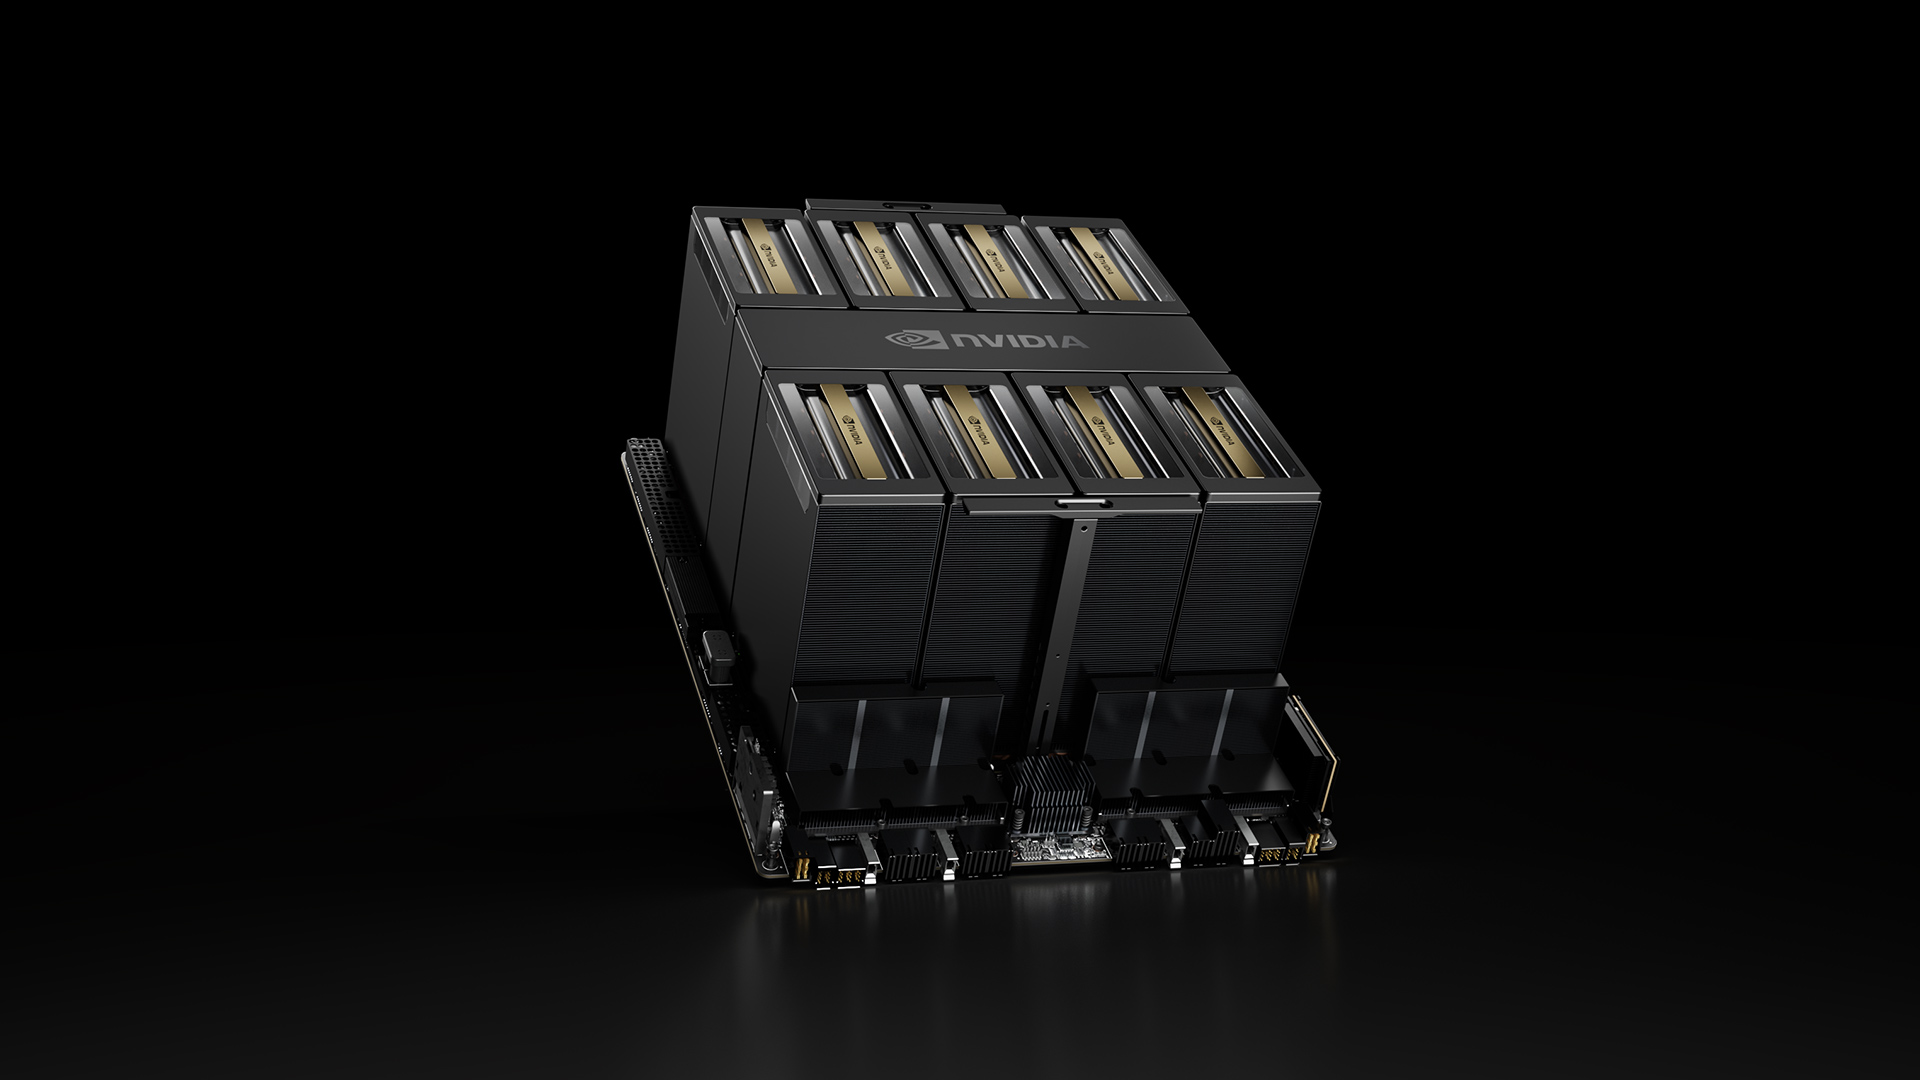
NVIDIA HGX B200 Reduces Embodied Carbon Emissions Intensity
NVIDIA HGX B200 lowers embodied carbon intensity by 24% vs. HGX H100, while delivering higher AI performance and energy efficiency. This article reviews the PCF-backed improvements, new hardware features, and implications for developers and enterprises.

Shadow Leak shows how ChatGPT agents can exfiltrate Gmail data via prompt injection
Security researchers demonstrated a prompt-injection attack called Shadow Leak that leveraged ChatGPT’s Deep Research to covertly extract data from a Gmail inbox. OpenAI patched the flaw; the case highlights risks of agentic AI.
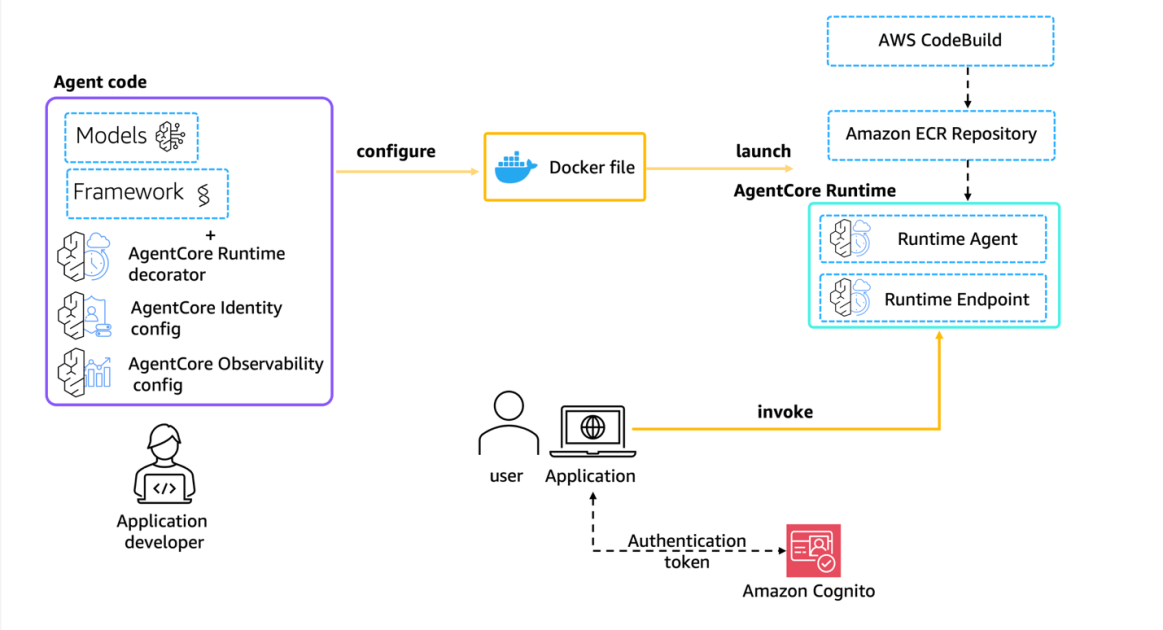
Move AI agents from proof of concept to production with Amazon Bedrock AgentCore
A detailed look at how Amazon Bedrock AgentCore helps transition agent-based AI applications from experimental proof of concept to enterprise-grade production systems, preserving security, memory, observability, and scalable tool management.

Predict Extreme Weather in Minutes Without a Supercomputer: Huge Ensembles (HENS)
NVIDIA and Berkeley Lab unveil Huge Ensembles (HENS), an open-source AI tool that forecasts low-likelihood, high-impact weather events using 27,000 years of data, with ready-to-run options.

Scaleway Joins Hugging Face Inference Providers for Serverless, Low-Latency Inference
Scaleway is now a supported Inference Provider on the Hugging Face Hub, enabling serverless inference directly on model pages with JS and Python SDKs. Access popular open-weight models and enjoy scalable, low-latency AI workflows.